function myChartjs (myLabelarray, myMaxarray, myActualarray) {
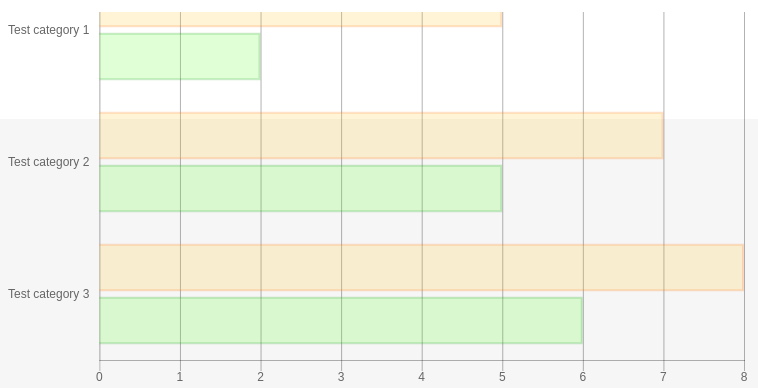
myChart1 = ‘horizontalBar’;
var chartOptions1 = {
scales: {
xAxes: [{
id : ‘x-axis-0’,
gridLines : {
display : true,
lineWidth : 1,
color : “rgba(0,0,0,0.30)”
},
ticks: {
beginAtZero :true,
mirror :false,
}
}],
yAxes: [{
id: ‘y-axis-0’,
gridLines: {
display: false
},
ticks: {
beginAtZero: true
}
}]
},
legend: {
position : ‘right’
}
}
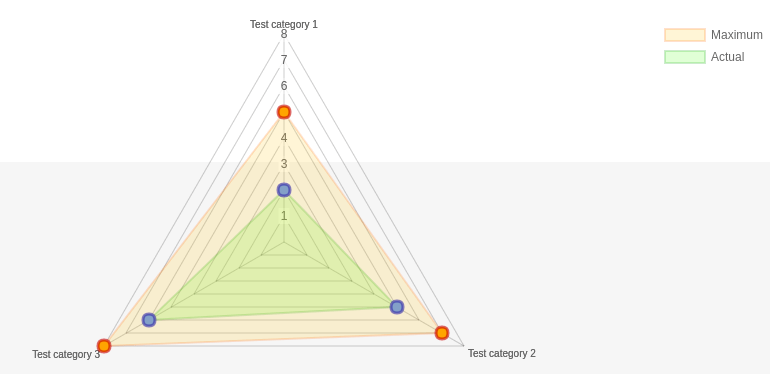
myChart2 = ‘radar’;
var chartOptions2 = {
scale: {
ticks: {
beginAtZero : true
}
},
legend: {
position : ‘right’
}
}
var myData = {
labels: myLabelarray,
datasets: [{
label: “<?php echo ‘CESMaximun’ ?>”,
backgroundColor: “rgba(255,204,51,0.2)”,
borderColor: “rgba(255,102,0,0.2)”,
borderWidth: 2,
radius: 6,
pointRadius: 6,
pointBorderWidth: 3,
pointBackgroundColor: “orange”,
pointBorderColor: “rgba(200,0,0,0.6)”,
pointHoverRadius: 10,
data: myMaxarray
}, {
label: “<?php echo ‘CESActual’ ?>”,
backgroundColor: “rgba(102,255,51,0.2)”, // Light green
borderColor: “rgba(0,153,0,0.2)”,
borderWidth: 2,
radius: 6,
pointRadius: 6,
pointBorderWidth: 3,
pointBackgroundColor: “cornflowerblue”,
pointBorderColor: “rgba(0,0,200,0.6)”,
pointHoverRadius: 10,
data: myActualarray
}]
};
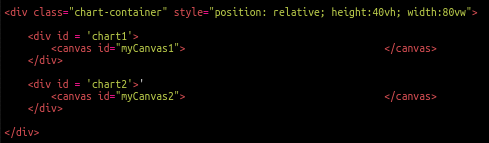
var radarChart1 = new Chart(myCanvas1, {
type : myChart1,
data : myData ,
options : chartOptions1
});
var radarChart2 = new Chart(myCanvas2, {
type : myChart2,
data : myData ,
options : chartOptions2
});
}

You must be logged in to post a comment.